
The concern index tracks how concerned I should be when I take my activities into account. Because tracking my mood didn’t work for me, I found that tracking my activity is another way of indirectly tracking my mood. I need to do this because I would like to find patterns in my mood and activity, and hopefully make predictions for the future.
Below is my concern index for the first six months of 2024, implemented into Microsoft Excel.
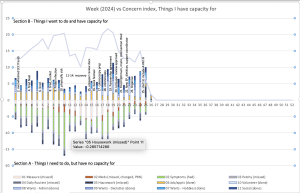
There are several features of this graph:
- Each stacked column is a week’s worth of activity, divided into types of activity.
- Section A (below the x-axis) are the things I need to do, but have no capacity for. These are things such as when I miss doing something, or when my routine changes, or any medical symptoms that I had.
- Section B (above the x-axis) are the things that I want to do, and have capacity for. Things such as appointments, volunteering, admin, decluttering, hobbies, and social.
- Concern index is the light blue line, and it is the sum of the magnitudes of Sections A and B. The higher the concern index, the more concerned I should be.
- I’ve marked what was generally happening each week with text next to each column.
Here is a download of the excel template for you to try out.